
SUN TRIP TOUR
Datavisualisation 2017
THE CONTEXT
To promote the launch of the company's new data analysis service, they participated in the Tour with a bike they had build themselves. The bike was connected to local servers and we could analysed and display the live streams of data during the race.
THE PROPOSAL
We wanted to allow viewers to follow our participants live and experience the road by sharing the photos taken along the road, and dive deep into the technical aspects of the race in a fun and colorful way.
HAD FUN WITH...
The loader change everyday based on the front runner’s new position, giving a sense of his advancement in the race while the rest of the content loads.
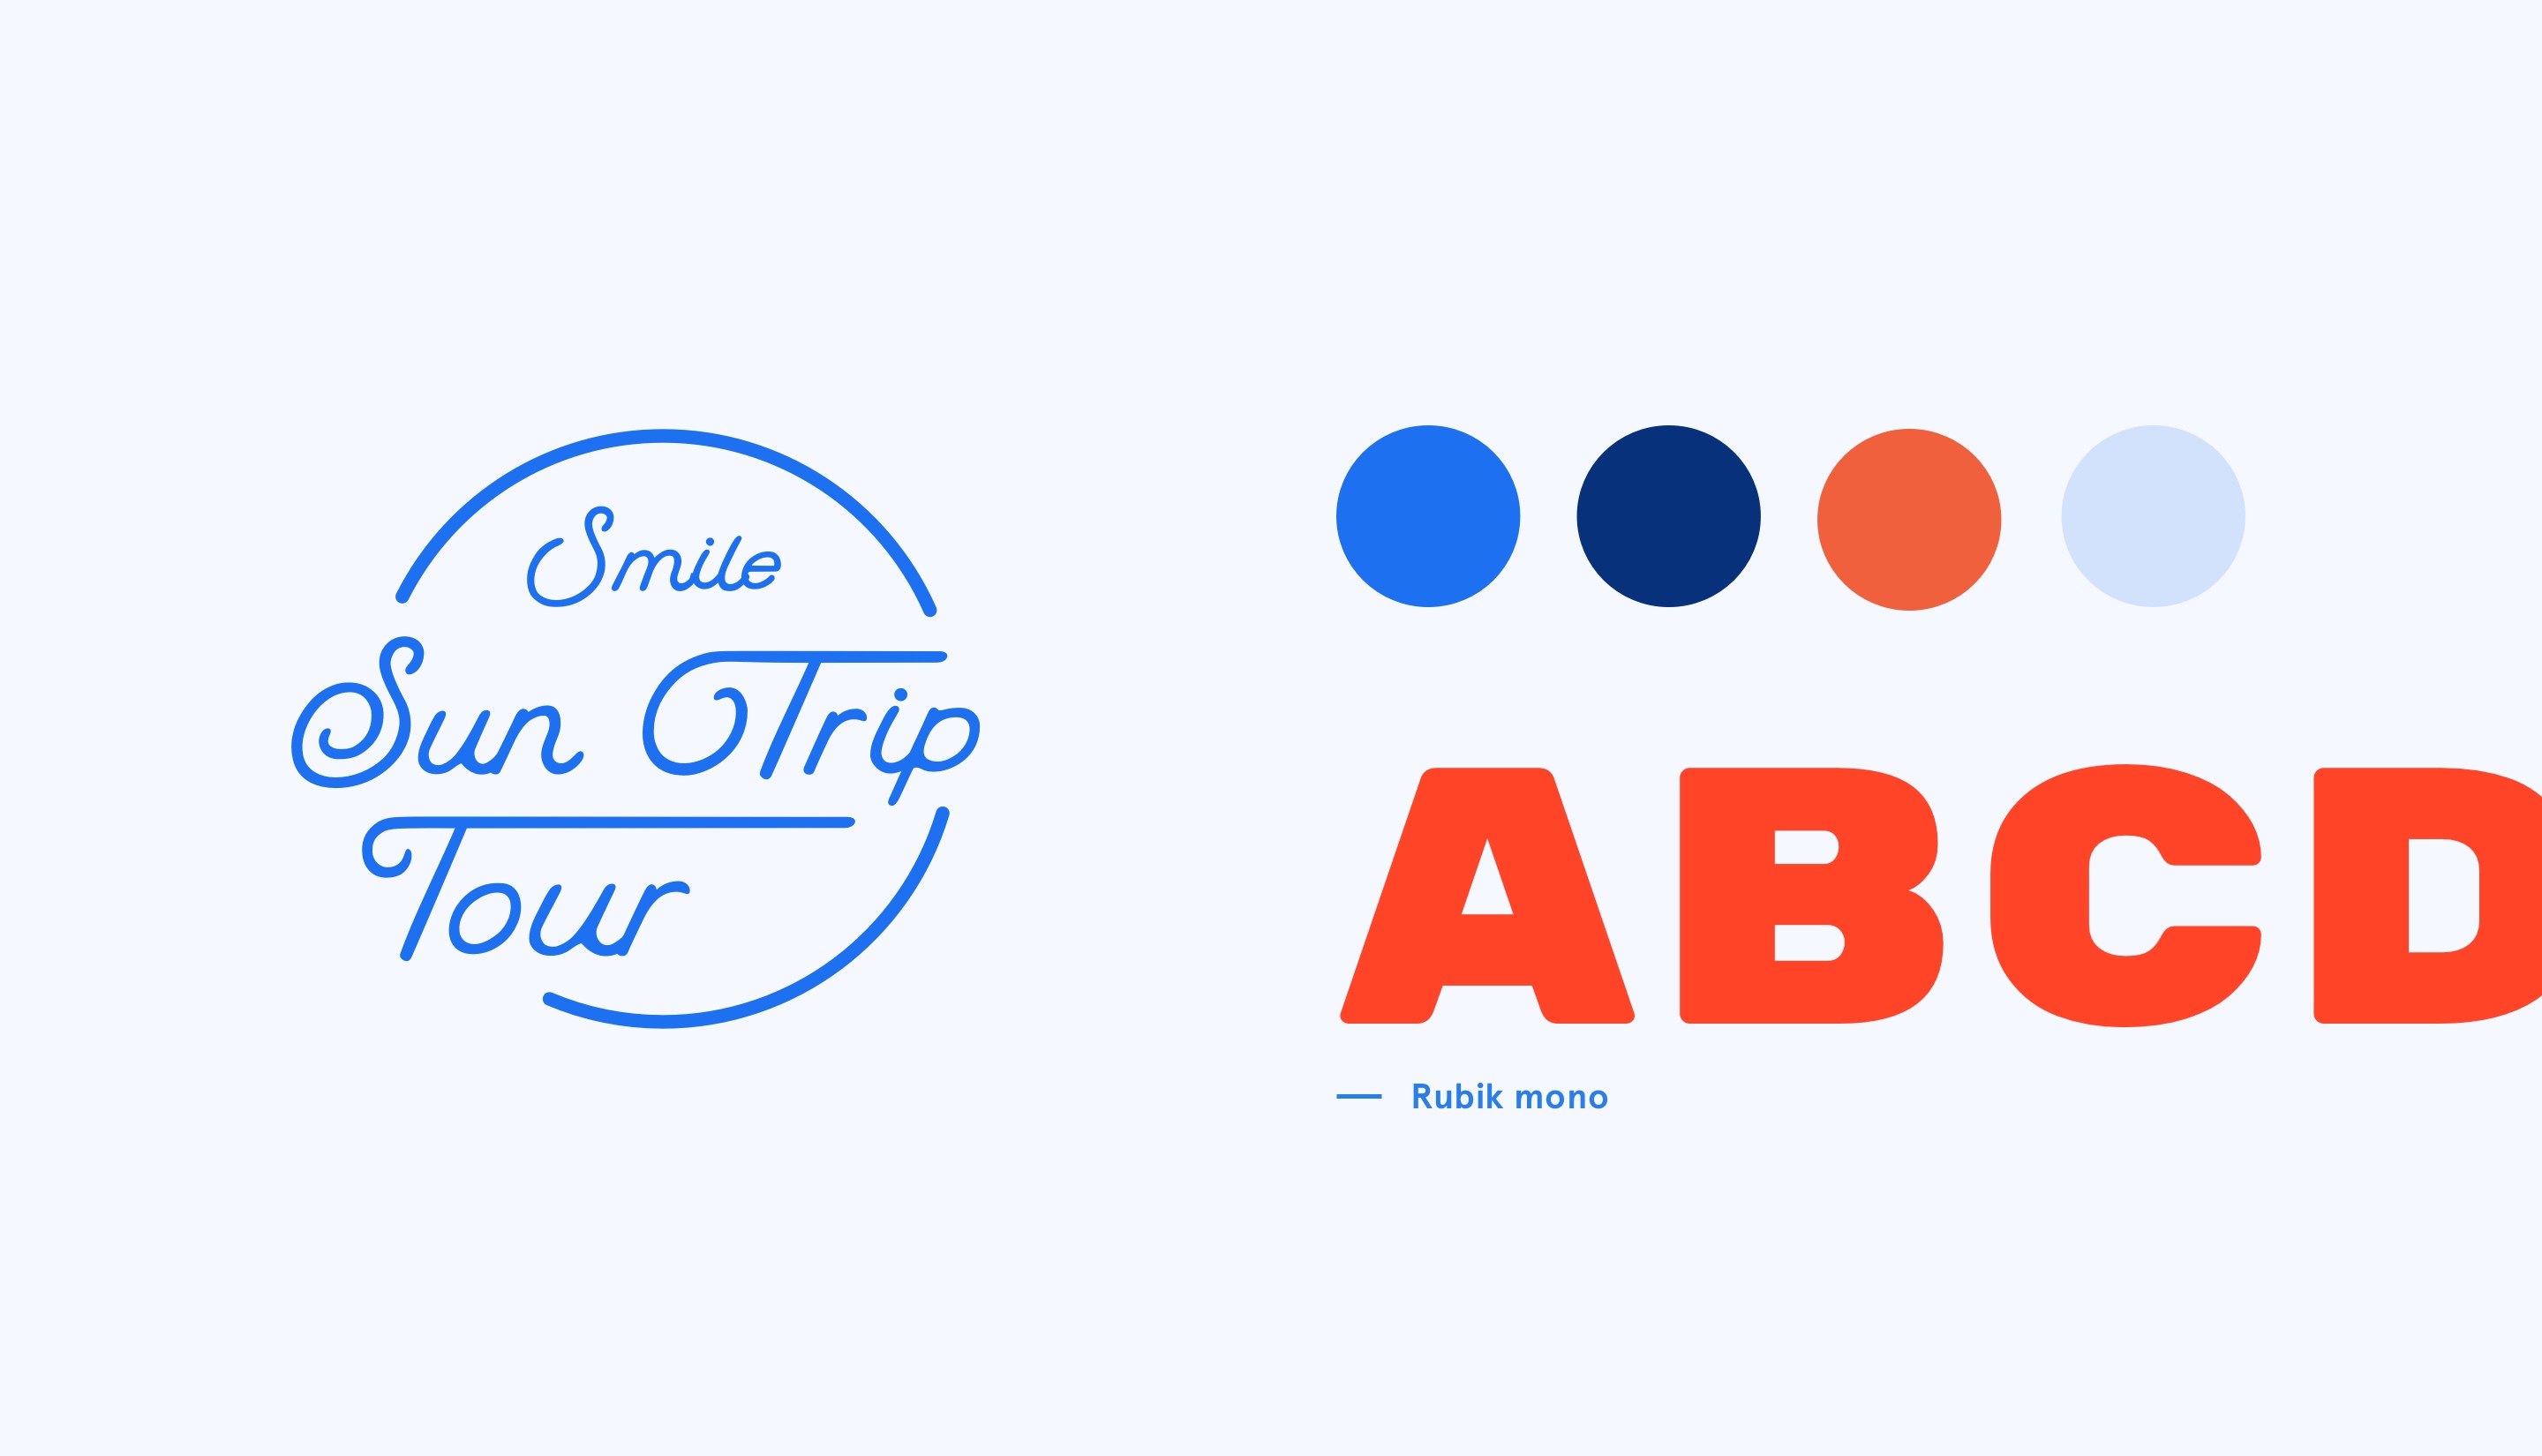
A PLAYFUL DIRECTION
Summer was coming and we were looking for an art direction that matched the chill and exciting mood you get into before holidays. And as we would give visitors a quick view on what kind of road trip you could do with a solar panel plugged to your head, we thought : why not go for something more colorful than usual?
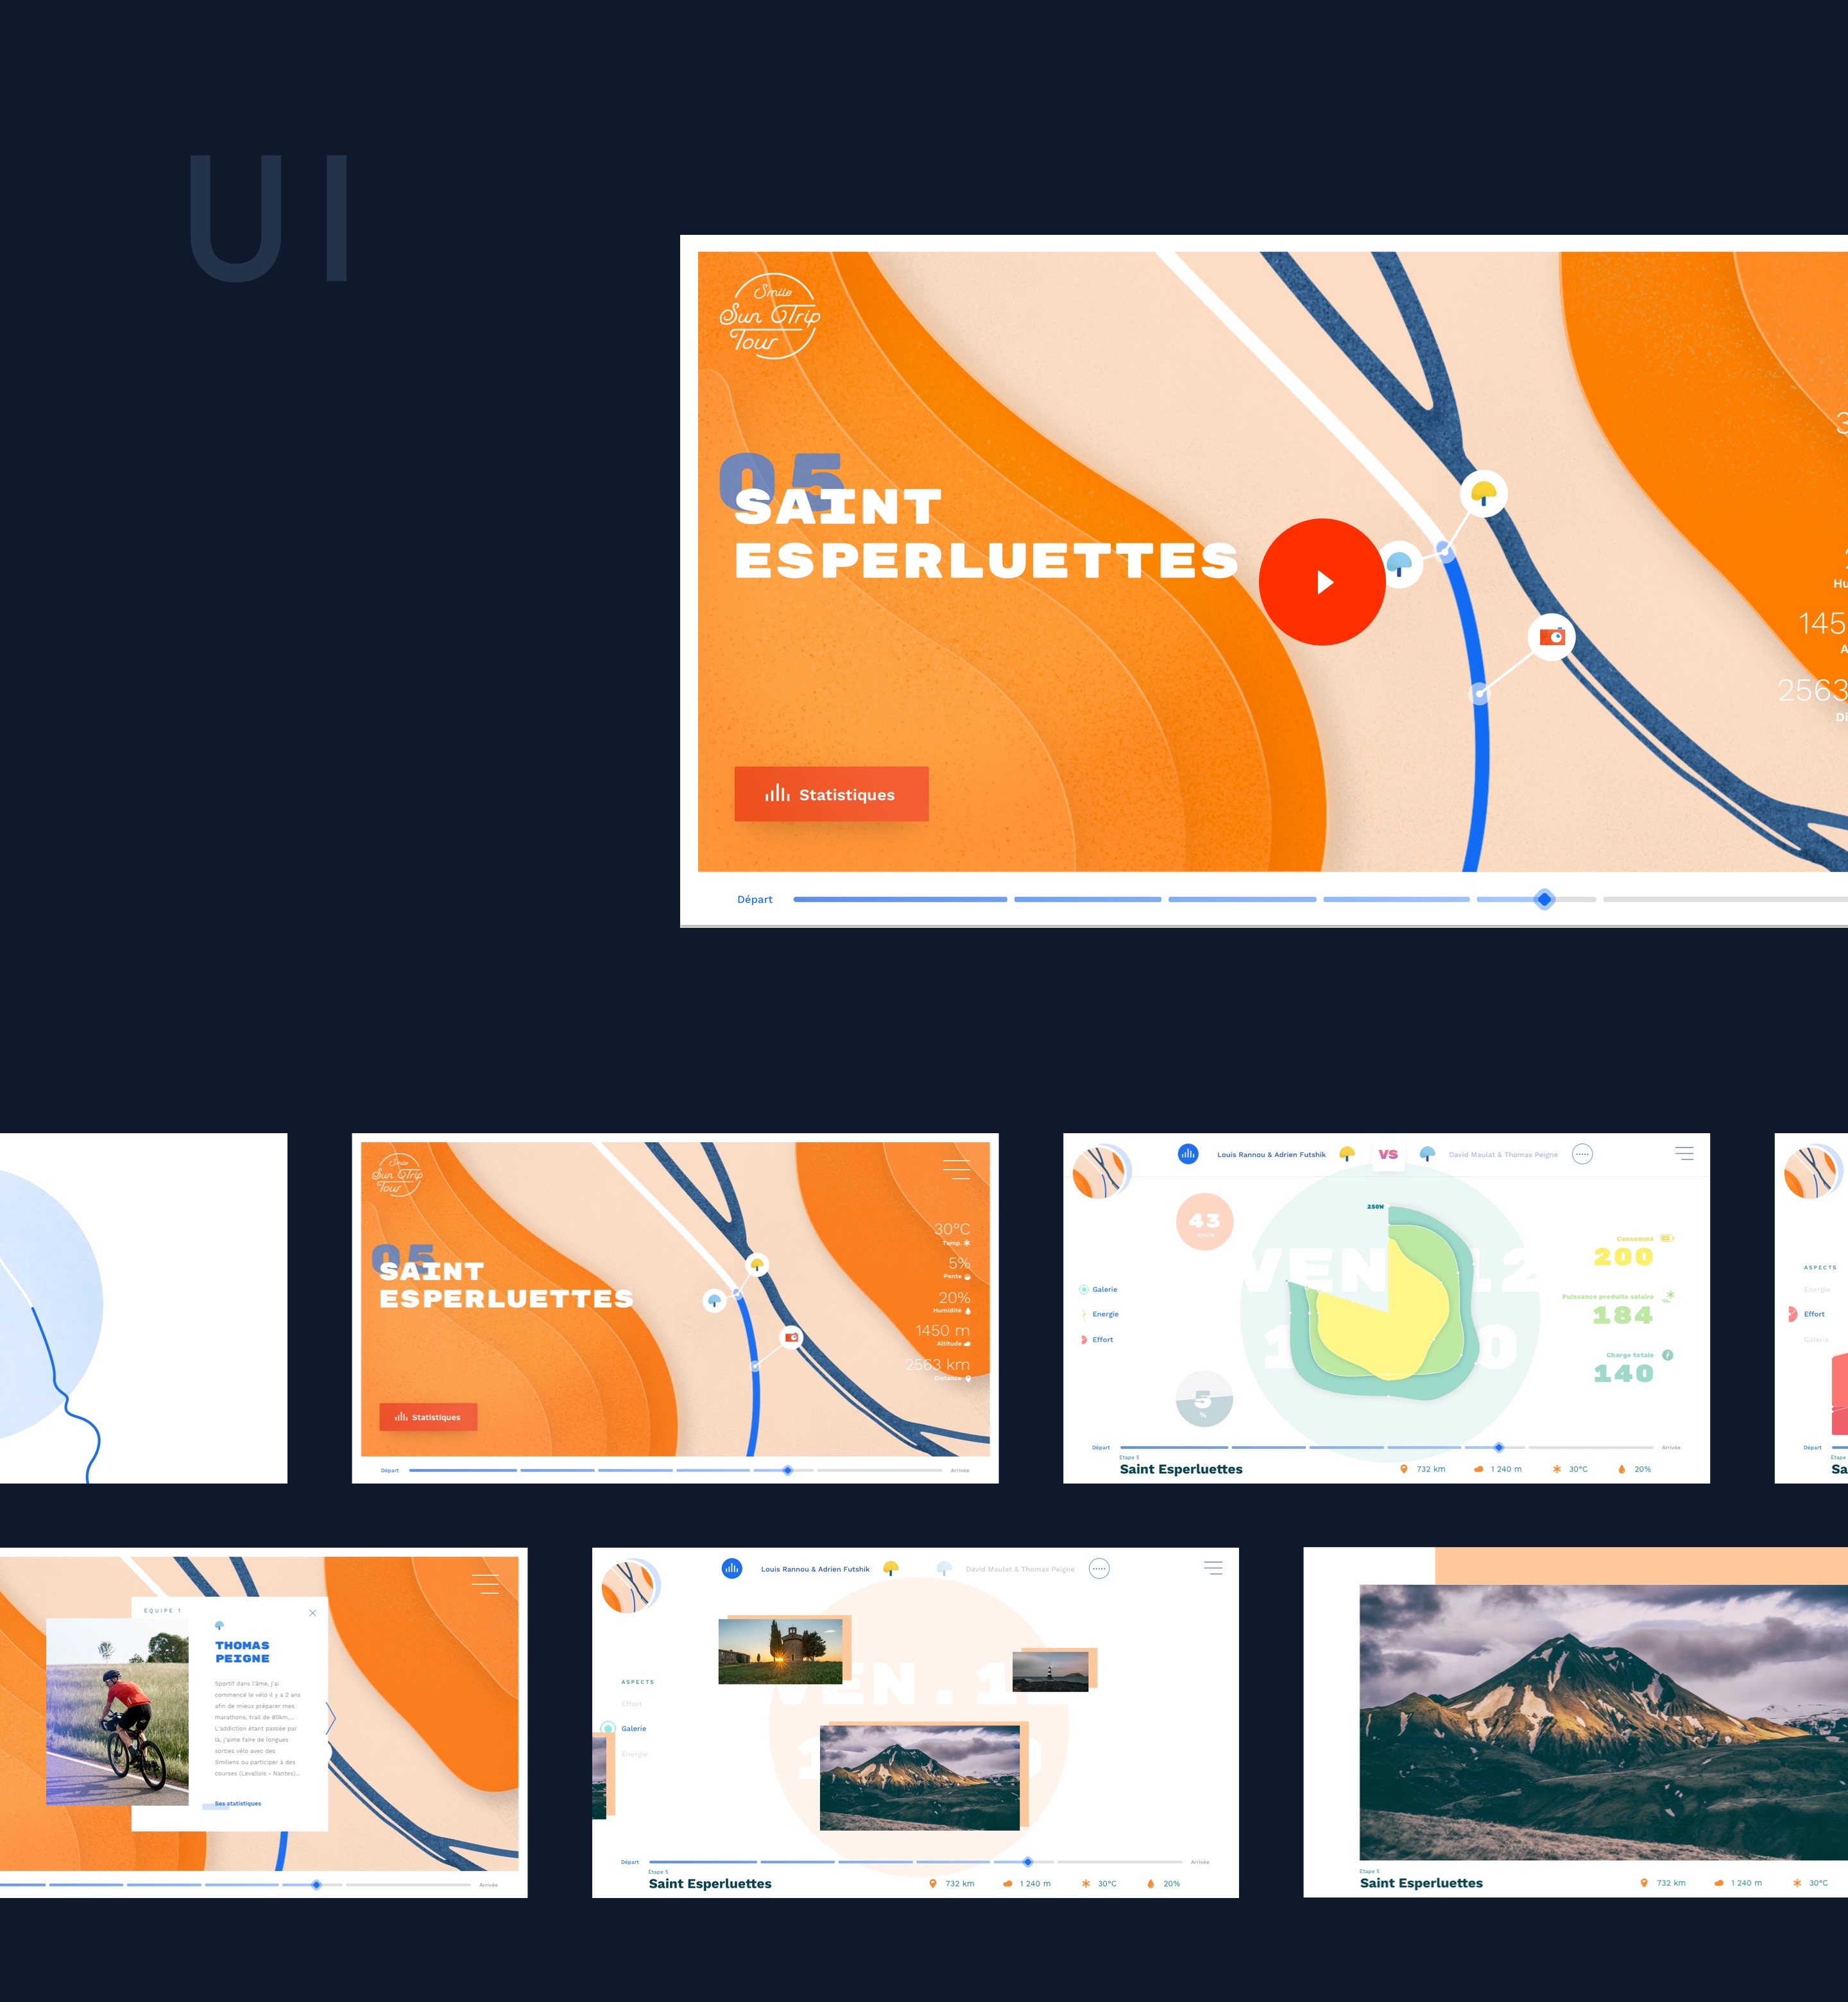
CUSTOM MAP WITH SMOOTH INTERACTIONS
I had some time to dabble around and felt for Mark Conlan's illustration style at the time. So the map was a perfect playground to try to adapt it to our case. The whole website was also a way for the team to work more with interactions and animations, so we tried to think about how we could create an animation language, which would convey our intention across the website.